
Bond total
Tax Impact
This page states the Building Bonds total as a composition of construction costs and interest over 15 years, and shows a simplified, dual-sourced household impact table from official tax materials. Print this page for a clean monochrome-friendly copy.
Building Bonds statement
$5,450,000 Building Bonds
Financing composition
Financing composition: The same $5,450,000 total is also shown as $3,490,000 construction plus $1,960,000 interest over this site’s 15-year financing display. These two lenses describe different breakdowns of one total — they are not interchangeable line items.
How the financing composition adds up
$5,450,000 equals $3,490,000 construction costs plus $1,960,000 interest over 15 years. Interest rate is to be determined.
Construction costs
$3,490,000
$3.49M
Interest over 15 years
$1,960,000
$1.96M
Rate: to be determined (TBD)
Total
$5,450,000
$5.45M
Financing composition: $3,490,000 + $1,960,000 = $5,450,000
The $5,450,000 total matches official Tax Impact materials. The construction and interest split is the board-stated financing composition that sums to that total; it is not restated on the district Tax Impact PDF/JPEG. Interest rate is not stated in available primary sources and is shown as to be determined (TBD). Interest $1,960,000 (composition) · Rate TBD.
These are two labeled ways to describe the same $5,450,000 total — project authorization lines vs financing composition — not two different bond packages and not a double count. For project authorization lines (HVAC + building), see The WHY or FAQs.
Not a personalized tax bill and not tax advice. The interest figure shown is part of the financing composition, not a published coupon rate.
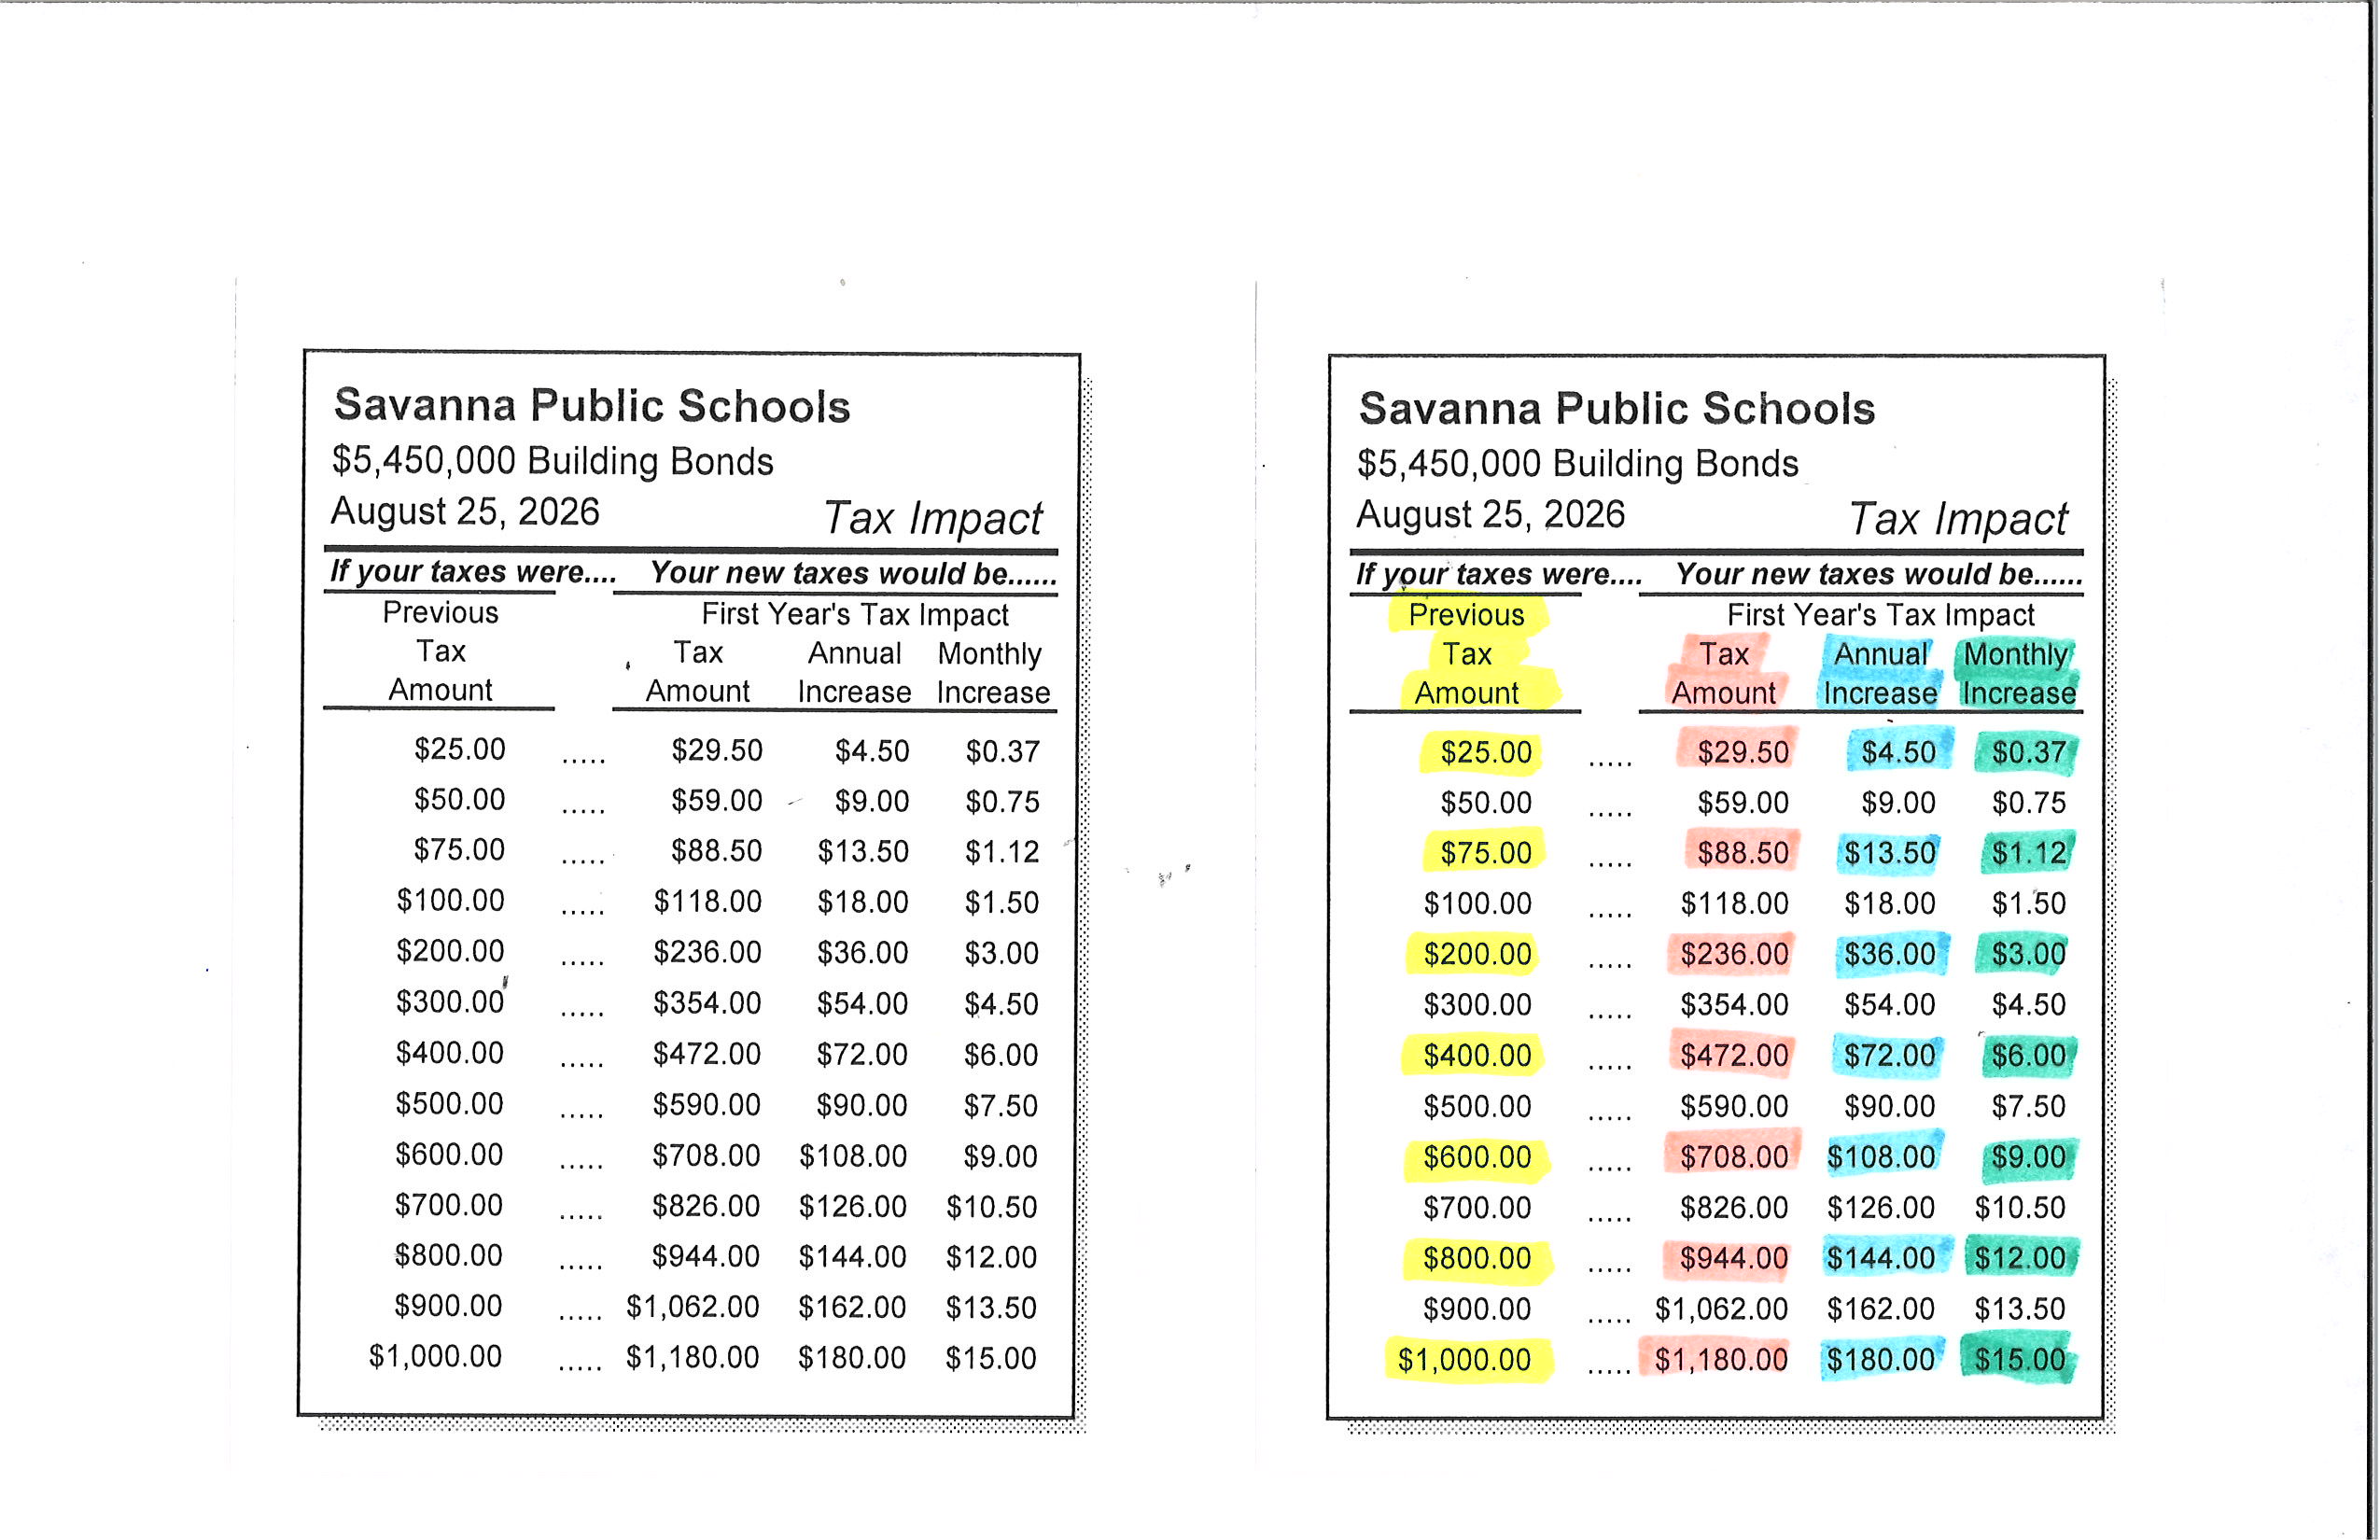
First-year household impact from the district Tax Impact handout: if your previous school tax amount were one of the sample rows below, the new tax, annual increase, monthly increase, and approximate % increase are shown. Figures are dual-sourced from the official PDF and JPEG (linked below).
Simplified example table
Previous Tax Amount is the prior annual school-related tax figure on the district handout — not home market value. Approximate % tax increase = annual increase ÷ previous tax amount. All 13 official sample rows show the same ~18% first-year increase.
About 18% more than the previous tax amount shown — the same approximate first-year increase on every official sample row.
| Previous tax amountIf your taxes were… | New tax amountFirst year | Annual increaseFirst year | Monthly increaseFirst year | Approx. % tax increaseAnnual ÷ previous |
|---|---|---|---|---|
| $25.00 | $29.50 | $4.50 | $0.37 | 18% |
| $50.00 | $59.00 | $9.00 | $0.75 | 18% |
| $75.00 | $88.50 | $13.50 | $1.12 | 18% |
| $100.00 | $118.00 | $18.00 | $1.50 | 18% |
| $200.00 | $236.00 | $36.00 | $3.00 | 18% |
| $300.00 | $354.00 | $54.00 | $4.50 | 18% |
| $400.00 | $472.00 | $72.00 | $6.00 | 18% |
| $500.00 | $590.00 | $90.00 | $7.50 | 18% |
| $600.00 | $708.00 | $108.00 | $9.00 | 18% |
| $700.00 | $826.00 | $126.00 | $10.50 | 18% |
| $800.00 | $944.00 | $144.00 | $12.00 | 18% |
| $900.00 | $1,062.00 | $162.00 | $13.50 | 18% |
| $1,000.00 | $1,180.00 | $180.00 | $15.00 | 18% |
Monthly figures match the published handout (source uses ROUNDDOWN of annual÷12 to cents). This simplified table re-keys official numbers only; download the PDF/JPEG for the primary source, or the spreadsheet for formula checks.
Official Tax Impact downloads
- Tax Impact PDF
- Tax Impact JPEG
- Simplified tax impact spreadsheet (XLSX)
See also the full Downloads hub.